d'Vinci Interactive is an award-winning comprehensive learning solutions provider for corporate, government, medical, non-profit, and K-12 target markets.

Unleashing the Power of Data Visualization: Creating Engaging Data-Driven Experiences for Users
May 13, 2024

In today's data-driven landscape, where spreadsheets with thousands or even millions of rows are increasingly common, learning leaders have a unique opportunity to evolve methods of displaying large amounts of consumable data in ways that engage and educate users. A properly organized dataset can help users find what they need and explore meaningful connections without becoming overwhelmed.
Embracing the Diversity of Data
While there are various types of data collections to explore, content data holds a prominent place, especially in catering to users with less technical backgrounds. Content data encompasses educational materials, multimedia content, textual resources, event updates, and much more. Amidst the constant evolution and updating of data, the focus on content data provides a prime opportunity to craft engaging data-driven experiences for users outside of a standard search form.
Leveraging the Power of Content Management Systems
When it comes to managing and presenting content data, Content Management Systems (CMS) play a vital role when data sources are updated with any amount of frequency. Among popular CMS platforms like Drupal and WordPress, Drupal stands out for its robust capabilities, especially in handling larger datasets and enhancing website functionality beyond basic structures with its ability to scale.
By using a CMS, content administrators can provide fresh and new content that seamlessly and effortlessly becomes part of visualization and search results.
Case Study: Wilson Center Visualization
As a recent example, d’Vinci had the opportunity to work on the Wilson Center Data Visualization project. We were presented with a large dataset of documents and transformed it into an interactive and educational platform for users.
The Wilson Center Digital Archive is a resource where students, researchers, journalists, and others can access once-secret documents from governments and organizations all over the world. The digital archive features a rich collection of documents from more than 143 different countries and 215 different institutions.
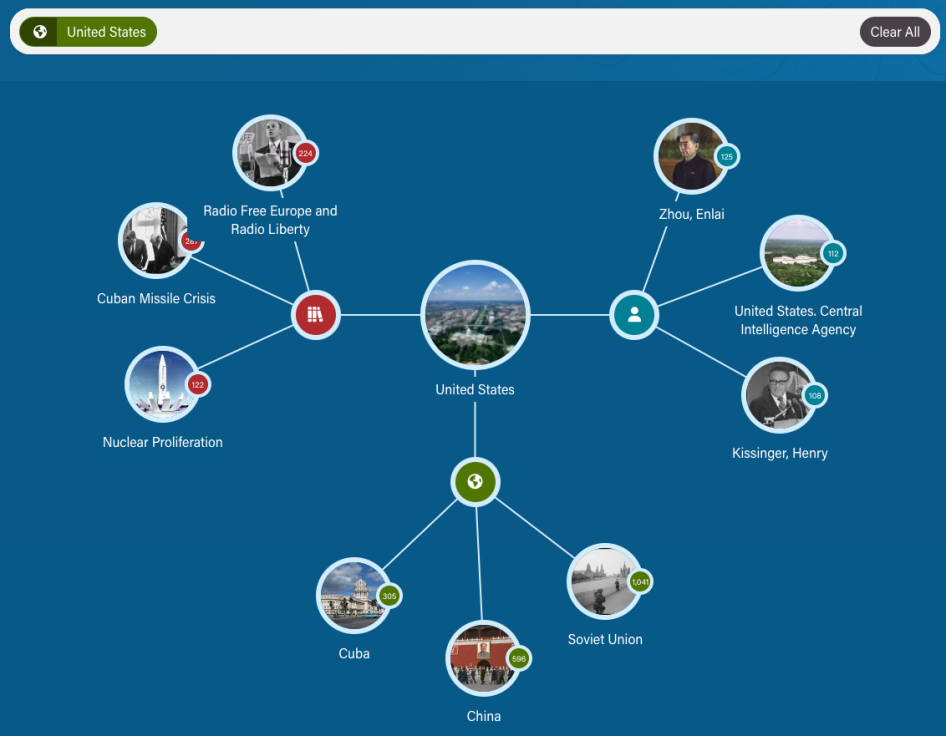
Our solution was to develop a conventional search tool for users who have a specific document in mind. Additionally, we created dynamic, interactive results for users whose exploration is driven more by curiosity and discovery than by seeking a particular item. By offering a search tool for users to locate specific documents and a visualization feature to explore content connections dynamically, the project exemplifies the art of presenting data in a simplified yet comprehensive manner.
Driving User Engagement Through Visualization
Initially, we were provided with a basic spreadsheet of documents. By identifying shared data points and connections, we transformed the dataset into a robust visualization tool. Leveraging Drupal's entity management system, we developed an organized data entry system that curated and presented the content in a structured, distinctive way. This allows users to explore the information in manageable segments while providing opportunities to discover new connections and documents.
Achieving Scalability and Flexibility
By adapting to changing data inputs, the visualization system for the Wilson Center ensures that new connections are continually generated, and visualizations are updated in real-time. This automated process relieves content creators of the burden of constant updates and allows for a scalable and dynamic data visualization experience.
Conclusion
The realm of data-driven experiences offers immense potential for users in the learning and development industry. By harnessing the capabilities of advanced data visualization tools and content management systems like Drupal, organizations can not only present data effectively but also foster a culture of curiosity and exploration among users. The path to engaging data-driven experiences begins with understanding the transformative impact of data visualization and the importance of user-centric design in today's information-rich landscape.
As technology continues to evolve, organizations can seize the opportunity to leverage innovative data visualization techniques to enhance user experiences and drive meaningful interactions with data.
Read more about The Wilson Center Digital Archive
Read Wilson Center Digital Archive Nets Two Training Industry Awards
Ready to Connect?
Contact us today to start the conversation. We work with you to find innovative solutions that drive a sense of shared accomplishment and trust.
